
Classes and streams
Organise your school into classes, and each class into streams, the way your timetable already works.
School in Stats is a marks app for teachers. Enter each learner's marks once, and it works out totals, means, positions and CBC performance levels, then produces the mark sheets and reports you need. It works even when you're offline.
Android app · English & Kiswahili · About the tester program
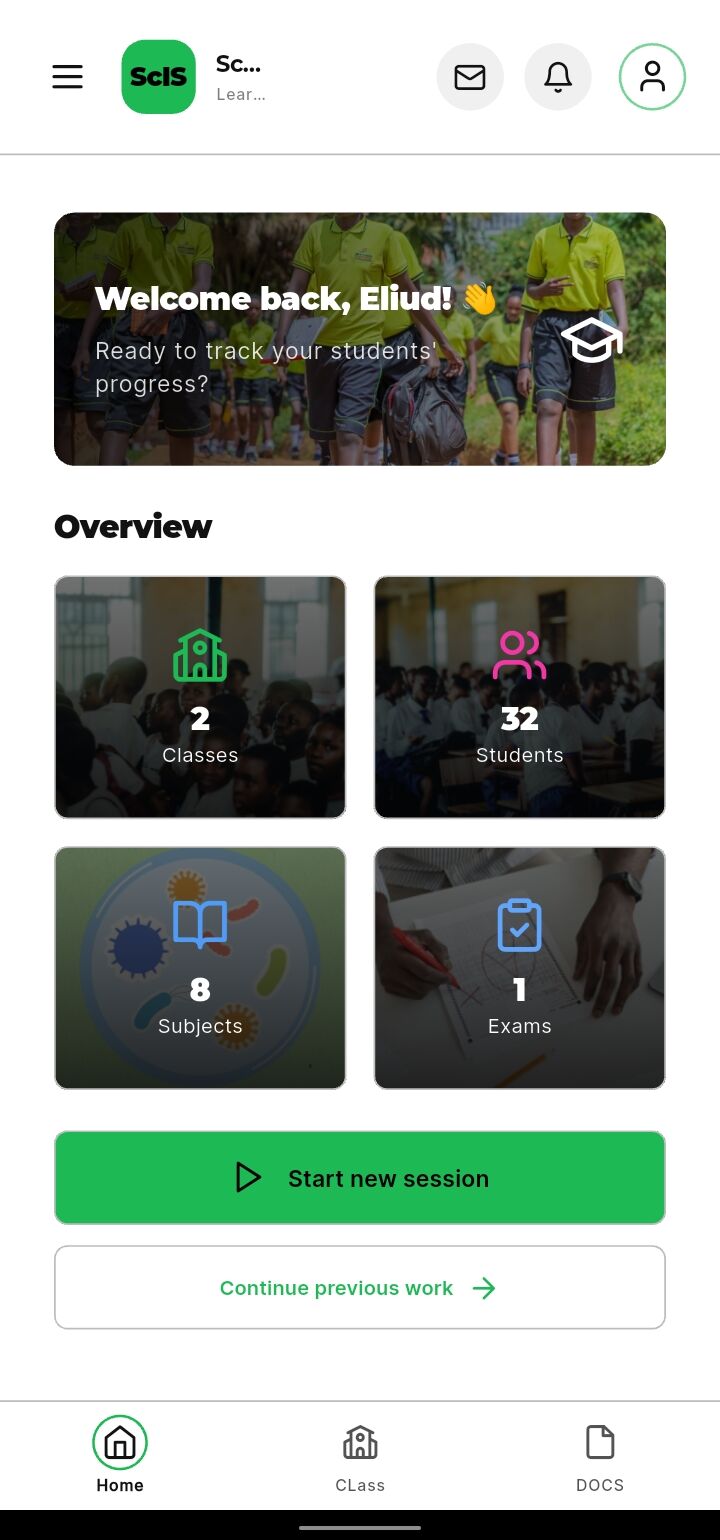
Screens from the School in Stats app
The problem
Most teachers already know this routine. It repeats after every exam, and most of it is arithmetic and copying numbers from one place to another.

Every manual step is another chance for a slipped digit or a wrong position, and every mistake means checking everything again.
School in Stats simplifies the routine. You collect and enter the marks. The app does the rest.
How it works
Enter your marks and the app handles the maths.
Create your class and its streams — up to eight per class.
List your learners once. They stay organised by stream.
Pick an exam and a subject, then type in each learner's score.
Totals, means, positions and performance levels are worked out for you.
Produce a class mark sheet or student reports, ready to print or share.
The product
These are real screens from the app, following the work you already do.
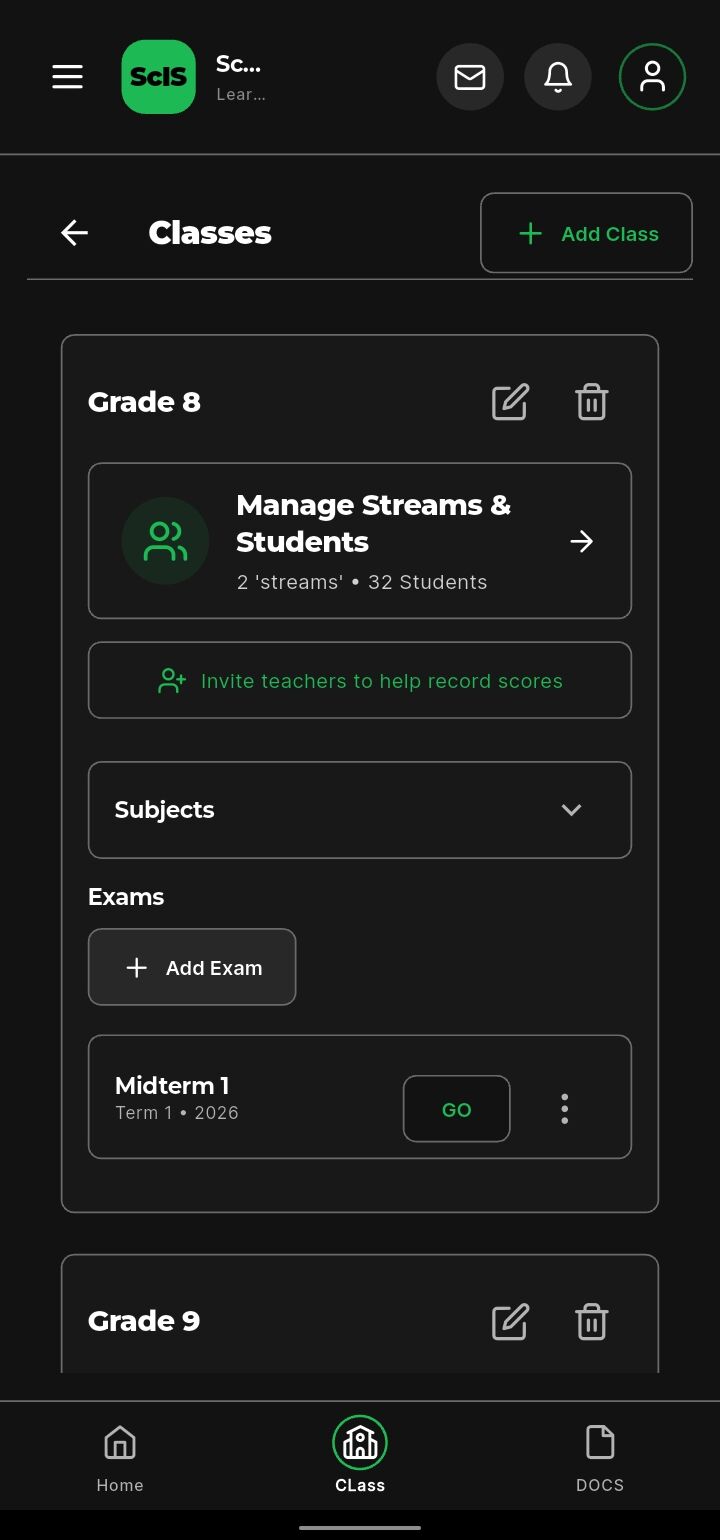
Add each class, split it into streams and add its subjects and exams. Every class shows its streams, number of students and exams at a glance.
Set up once, then reuse it for every exam.
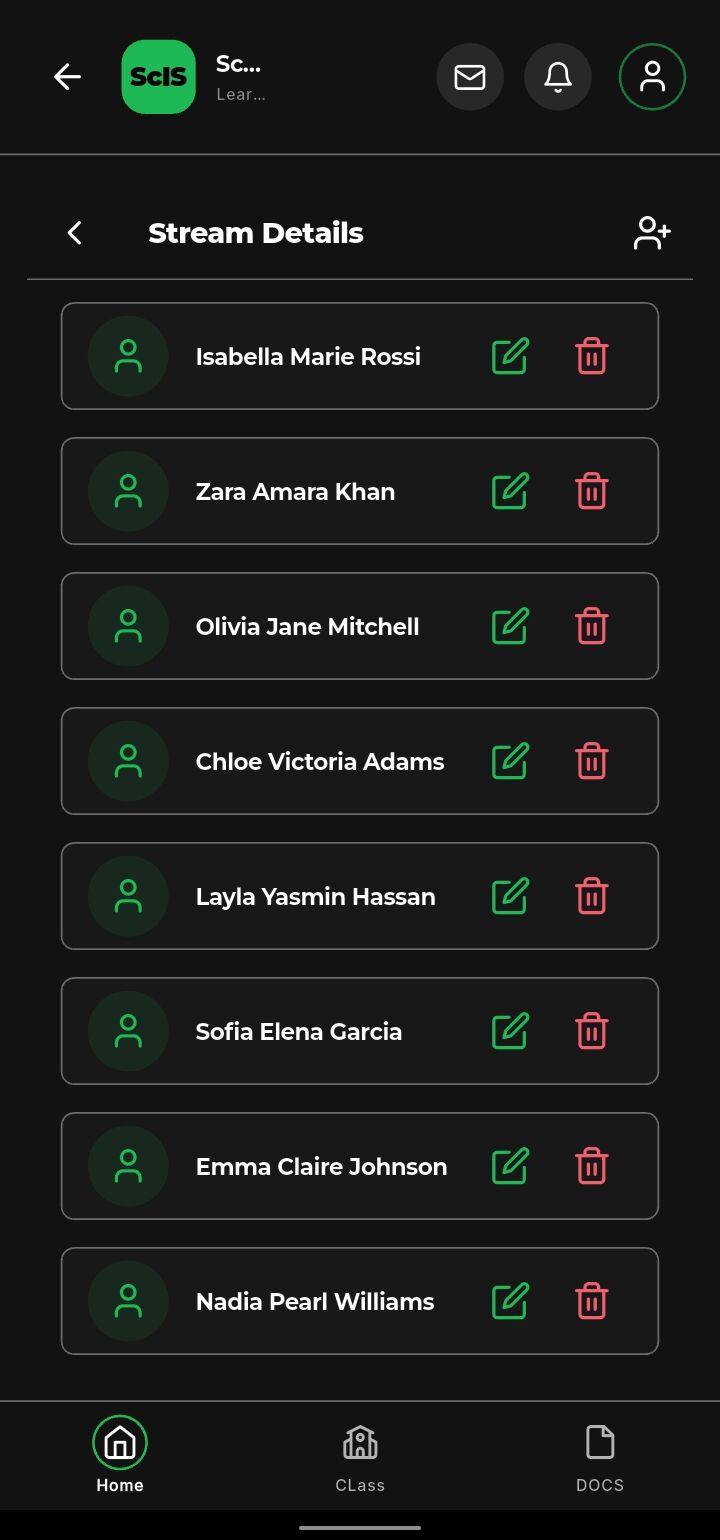
Add learners to each stream once. Edit or remove them any time, and they carry over to every exam.
No more re-typing learner lists.
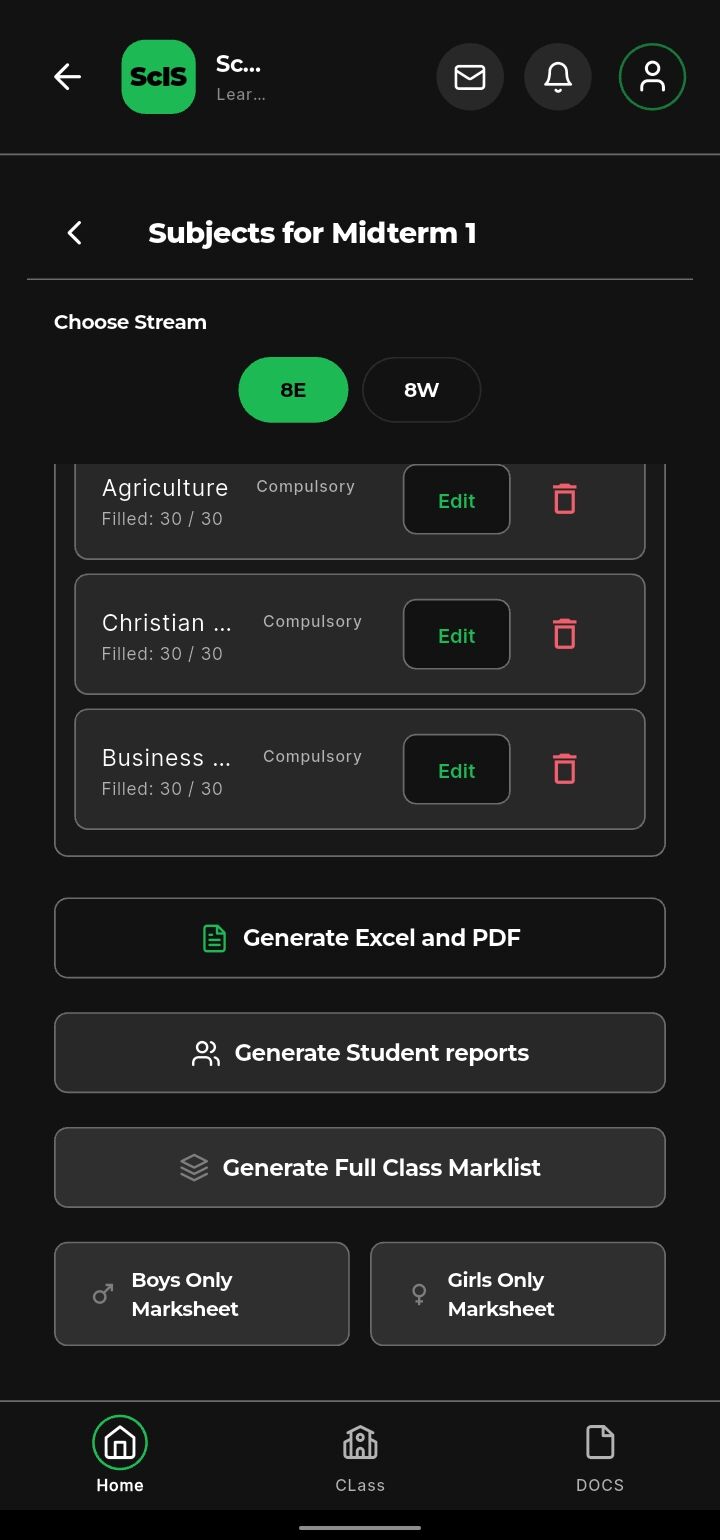
Enter marks subject by subject for each stream. Each subject shows how many learners have marks, such as 30 / 30, so you know when you're done.
Works offline. Your marks are saved on your phone.
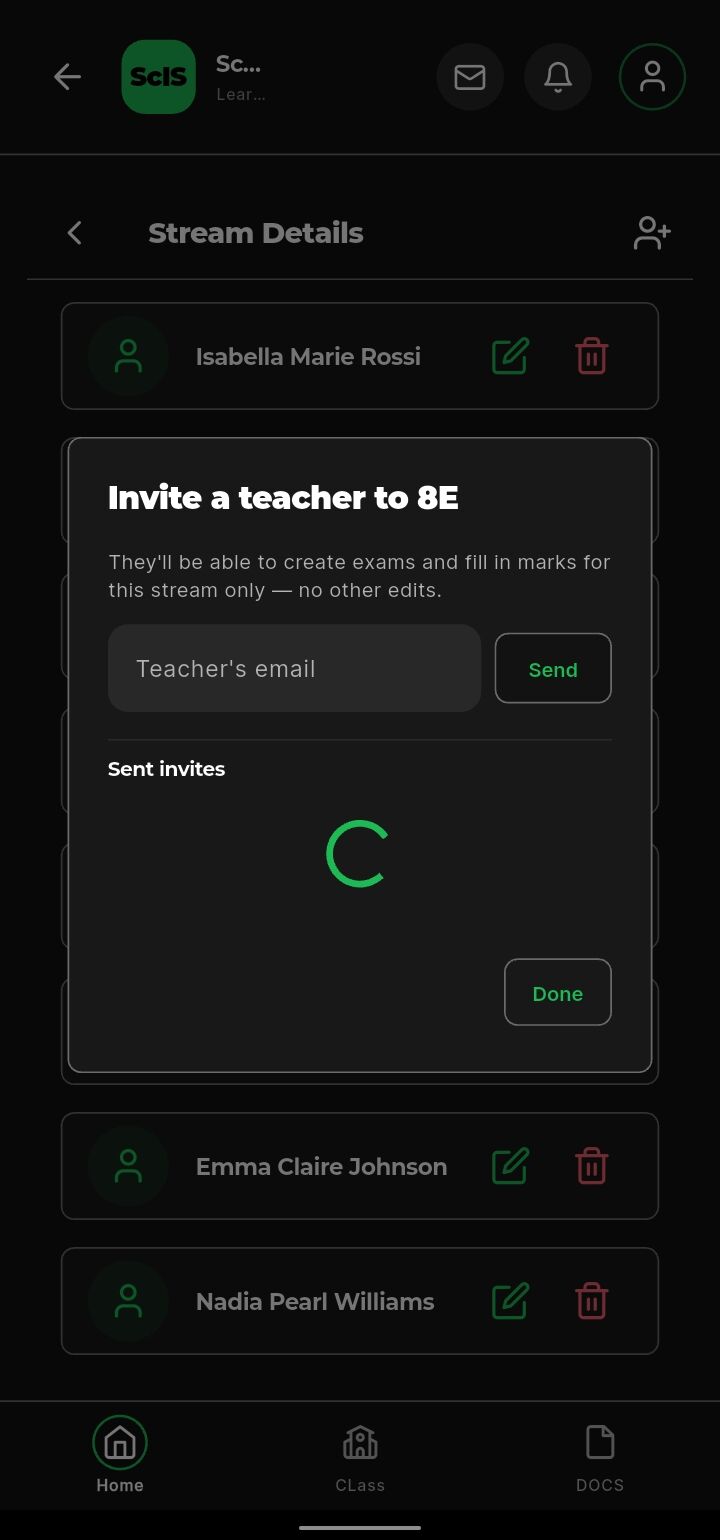
Invite a teacher to a stream by email. They can create exams and fill in marks for that stream only, with no other edits.
Stop collecting mark lists on paper.
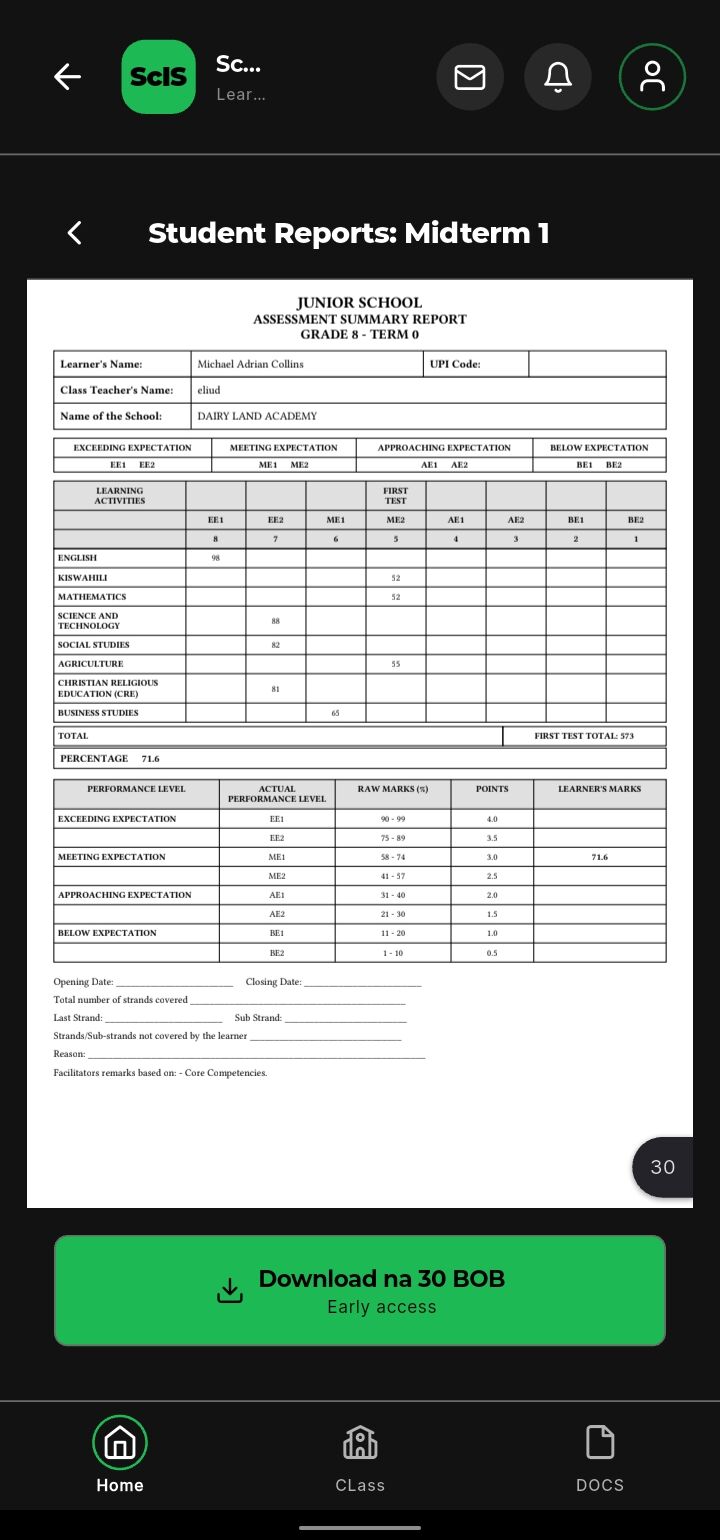
Generate a junior school assessment summary report for every learner, with CBC performance levels, percentage and points, plus the full class mark sheet.
PDF to print or share, or Excel.
Real screens from the app, shown with test data
Try it here
This is a small, simplified version of what School in Stats does. Change any mark below and the totals, means, performance levels and positions update straight away.
| Learner | Maths | English | Kiswahili | Int. Science | Total | Mean | Level | Pos |
|---|
No marks entered yet. Type a mark in any box to see the results.
Marks must be between 0 and 100.
We're inviting teachers to test School in Stats and share honest feedback before a wider release.
Features
Built around the way teachers already work, with no extra admin.
Organise your school into classes, and each class into streams, the way your timetable already works.
Keep every learner's details and marks together, organised by stream.
Enter scores subject by subject for each exam, with every learner listed in one place.
Totals, means and class positions are calculated for you — no formulas, no rechecking.
Marks are mapped to performance levels from EE1 to BE2, with points, in line with CBC reporting.
See the class mean, pass rate, subject performance, grade distribution and learners who need support.
A full class mark list with totals, positions, subject means and a rating key, plus boys-only and girls-only mark sheets.
An assessment summary report for each learner, ready to print or share with parents.
Generate results as a PDF to print or share, and as an Excel file when you need to work with them elsewhere.
Keep entering marks without internet. Your changes sync once you're back online.
Invite subject teachers to a stream so they can enter marks for their own subjects.
Use the app in the language you're most comfortable with.
Reports
Real output from the app: a class mark sheet and a report for every learner, laid out for printing. Tap to enlarge.
Every learner's marks with their performance level in each learning area, plus totals and positions — from a real Grade 8 class. You can also generate boys-only and girls-only versions. Names blurred for privacy.
A junior school assessment summary report for every learner, with each mark under its CBC performance level, plus the total, percentage and points.
Every mark out of 100 is mapped to a performance level and points, so you don't have to look them up.
| Level | Marks | Points | Meaning |
|---|---|---|---|
| EE1 | 90–99 | 4.0 | Exceeding expectation |
| EE2 | 75–89 | 3.5 | Exceeding expectation |
| ME1 | 58–74 | 3.0 | Meeting expectation |
| ME2 | 41–57 | 2.5 | Meeting expectation |
| AE1 | 31–40 | 2.0 | Approaching expectation |
| AE2 | 21–30 | 1.5 | Approaching expectation |
| BE1 | 11–20 | 1.0 | Below expectation |
| BE2 | 1–10 | 0.5 | Below expectation |
Performance analysis
See how your class and each subject are doing, and which learners need more support. You don't need a spreadsheet.
Offline-first
Many teachers work where the network comes and goes. School in Stats keeps your marks on your phone, so a weak signal never stops you.
Your classes, learners and marks sync with your account.
Keep entering marks. Everything is saved on your phone.
Your saved changes sync automatically in the background.
You'll need a connection to create your account and sign in for the first time.
Who it's for

You already have enough admin to do. School in Stats takes over the repetitive part of marks processing.

For class teachers, subject teachers, academic coordinators and administrators working on the same results.
Your data
Marks and learner details are sensitive. This is how School in Stats handles them.
Sign in with email and password, or with your Google or Facebook account.
Class teachers own their streams. Invited teachers can only enter marks for the stream they were invited to.
School data is shared only with the school that owns the account and the providers needed to run the service.
You can ask us to delete your account and its data at any time.
School in Stats is currently being tested with teachers. We're looking for teachers willing to try the app, use it with realistic marks workflows, and share honest feedback.
You don't need technical skills. Just use the app the way you normally process marks, and tell us what works, what doesn't and what could be better.
Fill in the short tester form so we know who you are and how you work.
Become a Tester (opens in a new tab)Join the WhatsApp tester group for testing updates, questions and quick feedback.
Join WhatsApp Group (opens in a new tab)Use School in Stats for real marks work, then tell us what works and what doesn't.
Pricing
Setting up classes, entering marks and previewing reports is free. During early access, you pay a small fee to download a mark sheet or student reports as a PDF, and the app shows the price before you pay. We'll publish plans for whole schools before a wider release.
FAQ
School in Stats is a marks app for teachers. You enter your learners' marks, and it calculates totals, means, positions and CBC performance levels, shows class analytics, and generates class mark sheets and student reports.
Class teachers, subject teachers and the people who manage marks in a school — heads of department, academic coordinators and administrators.
Yes. Marks you enter are saved on your phone, so you can keep working without a connection. When you're back online, your changes sync automatically. You need a connection to create your account and sign in.
Yes. You can generate a full class mark list, boys-only and girls-only mark sheets, and a junior school assessment summary report for each learner — as PDFs to print or share, and as Excel.
Yes. A school can have several classes, and each class can have up to eight streams.
Yes. School in Stats uses CBC performance levels (EE1 to BE2), and the student report is laid out as a junior school assessment summary.
Yes. A class teacher can invite subject teachers to a stream. Invited teachers can create exams and enter marks for that stream only.
School in Stats is an Android app and is currently in closed testing. Sign up as a tester and we'll share access with you.
Setting up classes, entering marks and previewing reports is free. During early access, downloading a mark sheet or student reports as a PDF costs a small fee, shown in the app before you pay. Plans for whole schools will be published before wider release.
Your school's data is used only to run the app. We don't sell personal information, and you can ask us to delete your account and data at any time. See our Privacy Policy for details. Read the Privacy Policy.
Still have a question? Contact us

Join our closed testing program and help us build a marks app that fits the way teachers really work.
Have a question first? Contact us